










 5 MIN READ | By Tim Beasley | Updated on Nov 6, 2026
Three months into spring the national downturn has broadened and deepened, but Melbourne is now falling more slowly than any of the other major capitals. That is partly because we started earlier than other capitals.
How far, how fast
Melbourne's dwelling values fell just under 1% in October and close to 3% over the three months to the end of October. That is a slower rate of decline than August, when values fell more than 1% in a single month, and it is the smallest quarterly fall of the five major capitals. Brisbane fell 6% over the same three months, Perth nearly 6% and Sydney nearly 5%. Over the year Melbourne is down almost 8%, and the median dwelling value is now around $773,000.
Nationally, values fell just over 1% in October, the seventh straight monthly decline. The combined capitals are 8% below their March peak, which is the fastest fall in 40 years. The downturn is now in every capital, and in the mid-sized cities it has reached virtually every suburb.
Melbourne is falling more slowly than Brisbane, after far smaller gains
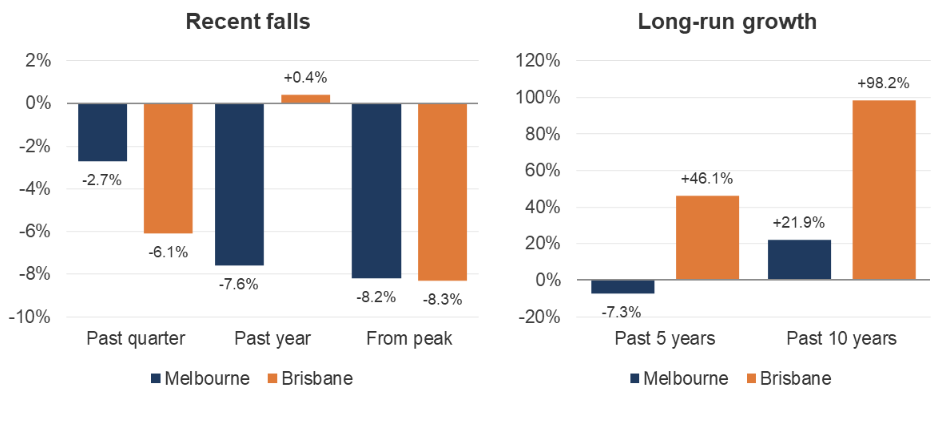
Change in dwelling values to 31 October 2026. Peaks: Melbourne March 2022, Brisbane May 2026. Source: Cotality Home Value Index, November 2026.
The difference in Melbourne is the starting point. Melbourne property prices peaked in March 2022 and have been drifting ever since. Melbourne values are 7% lower than they were five years ago. The cities now falling hardest are the ones that ran up hardest. As an example, Brisbane is still 46% above where it was five years ago. Melbourne simply has fewer "gains to give up". Zoom out a bit further, and the gap is starker still. Melbourne values have risen just 22% over the past ten years, barely 2% a year and less than inflation over the same period, against 98% in Brisbane. That is why we see the current falls here as the tail end of a long adjustment rather than the start of a new one. This is demonstrated below, which shows the difference in median prices between Melbourne and Brisbane is the highest it’s been in over 45 years and over 20 years between Melbourne and Sydney.
Brisbane houses now cost 23% more than Melbourne's, the widest gap since at least 1980
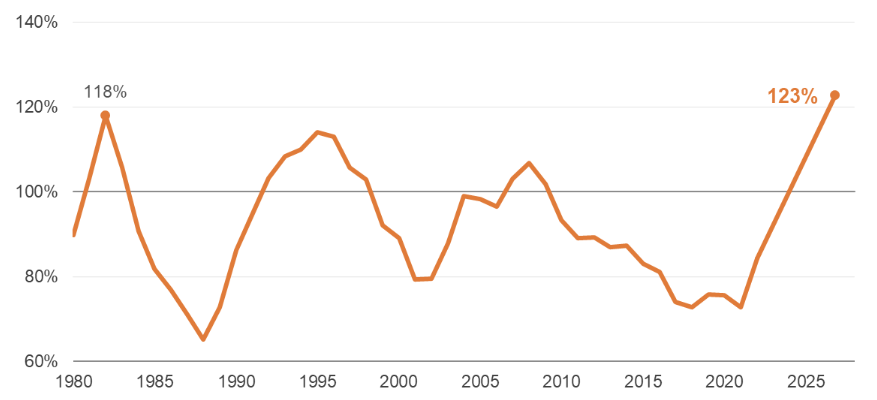
Median house price as a share of Melbourne's. 1980 to 2026: Cotality Home Value Index median house values.
Sydney's premium over Melbourne is the widest in more than 20 years
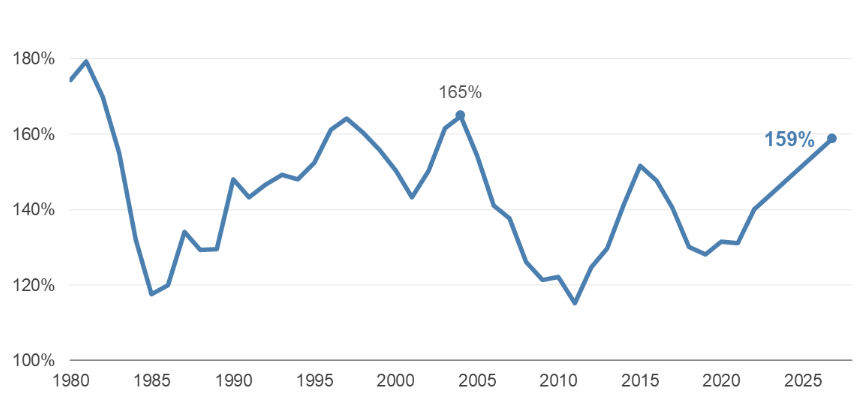
Median house price as a share of Melbourne's. 1980 to 2026: Cotality Home Value Index median house values.
Vendors are holding back, and buyers are absent
Melbourne is not short of stock, it is short of buyers. SQM Research counted over 51,000 homes listed for sale across Melbourne in October, a record for the city and 17% more than a year ago. New listings were 5% lower than last October. The stock is building because it is not selling, the number of properties that have sat on the market for more than six months is up 29% on a year ago. Melbourne auction clearance rates have hovered around 50% for four months, against the high 60s this time last year, and the number of homes going to auction is down more than 40%.
We can see the same thing in our own business. The number of clients telling us they intend to sell fell by close to 50% over the past three months compared with the three months before it, and sits below the same period last year. Fewer owners are choosing to test the market, and that restraint is doing a lot of the work in keeping Melbourne's falls modest.
There is not any one thing driving values lower. Higher interest rates have cut what buyers can borrow. Sentiment is low, and the Victorian election on 28 November has added a layer of political uncertainty on top. The May Budget changed the situation for many investors as well. We suspect we are also seeing investors holding onto existing properties to protect their grandfathered negative gearing: an investment property owned before Budget night keeps the current rules, while a replacement bought now does not. That is a strong reason to hold rather than sell and buy again, and it is one more thing keeping stock off the market.
The rental market: still tight, but growth is cooling
Melbourne rents rose around 4.5% over the past year. Growth is slowing though. National rents rose less than 1% over the past three months, the smallest quarterly rise since January 2025, and Melbourne's vacancy rate has edged up to 1.9%, from 1.8% a month earlier. That compares with 1.8% a year ago and 3.5% five years ago, so the market remains tight by any historical measure, just not quite as tight as it was.
But as always, averages across an entire market can be misleading. Dig a little further and the picture across Melbourne is much more mixed. Looking at our own portfolio (which at over 3,200 properties, is representative of Melbourne), rents are flat in the north and west, and rising fastest for cheaper homes in the east and south, at approximately double the average across the city. The outer east has led the way, with rents up 4.2% overall, but even here the difference in price point is high, with homes under $550 a week up 6% or more, while those above $800 rose only 2.4%.
In the inner south, homes under $450 a week rose 6.6%, the strongest result in our portfolio, against 2.5% for those over $800. At the other end, rents in the outer north rose just 1.0%, with fewer than half of tenancies getting any increase and no price band above 1.5%. The west has been flat at every price point, with only 28% of tenancies seeing an increase. The reason for this is that new rental supply has been most plentiful in the west.
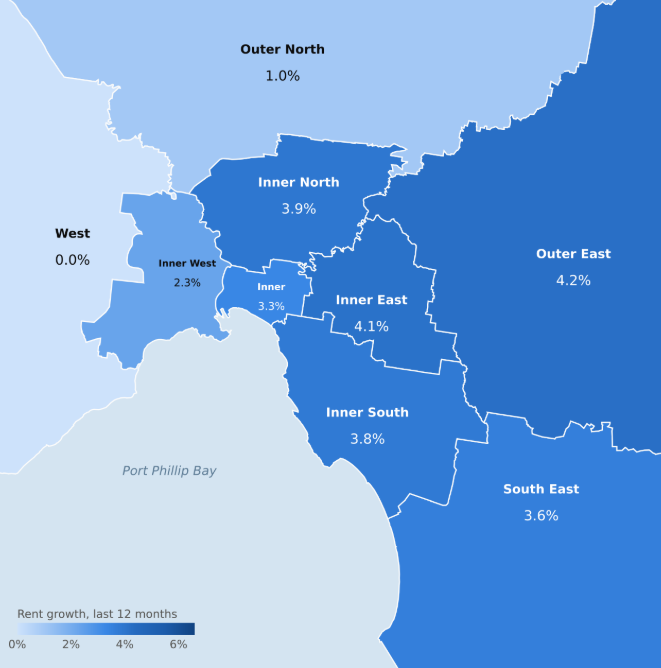
Average weekly rent growth, last 12 months. Source: LongView Melbourne Portfolio.
A few things worth remembering
-
The market is still falling. The pace of decline in Melbourne is slowing, which puts us in a better position than the other major capitals, but slower falls are still falls and we are not calling the bottom.
- Sentiment is firmly negative and will stay that way for a while. Rates have just gone up again, holding costs are rising with them, and the state election on 28 November gives buyers one more reason to sit on their hands until the picture clears.
- Most investors understand the market moves in cycles. Many of those with grandfathered negative gearing are choosing to hold rather than sell into a soft market, and that restraint is keeping stock tight.
- Rental growth is slowing, but it is still firmly positive across most of Melbourne. Rents are up around 4.5% over the year, vacancy is under 2% and yields are the highest in more than a decade.
If you are weighing up your next move
We know this is a tough time for many of our clients, particularly those carrying considerable debt. We also know that decisions in property are of great importance, so if you are considering selling or weighing up your options, please talk to us first so we can at least guide you through the options you have.
And as we have said before, for owners who need a medium term financial injection but do not want to sell, our HomeFlex equity release product is most certainly worth considering.